Monitor dockerhub rate limits with grafana
About • Usage • Image Configuration • Local Demo • Helm Chart • Todo • Issues • Acknowledgment
About
The exporter allows to retrieve the DockerHub rate limit counts as scrape target for Prometheus. The exporter obtains an auth token and then queries the Docker Hub registry with a HEAD request to parse RateLimit-Limit, RateLimit-Remaining and RateLimit-Reset into a Gauge metric. You can use your Docker Hub credentials to authenticate, otherwise an anonymous token is used.
Screenshot
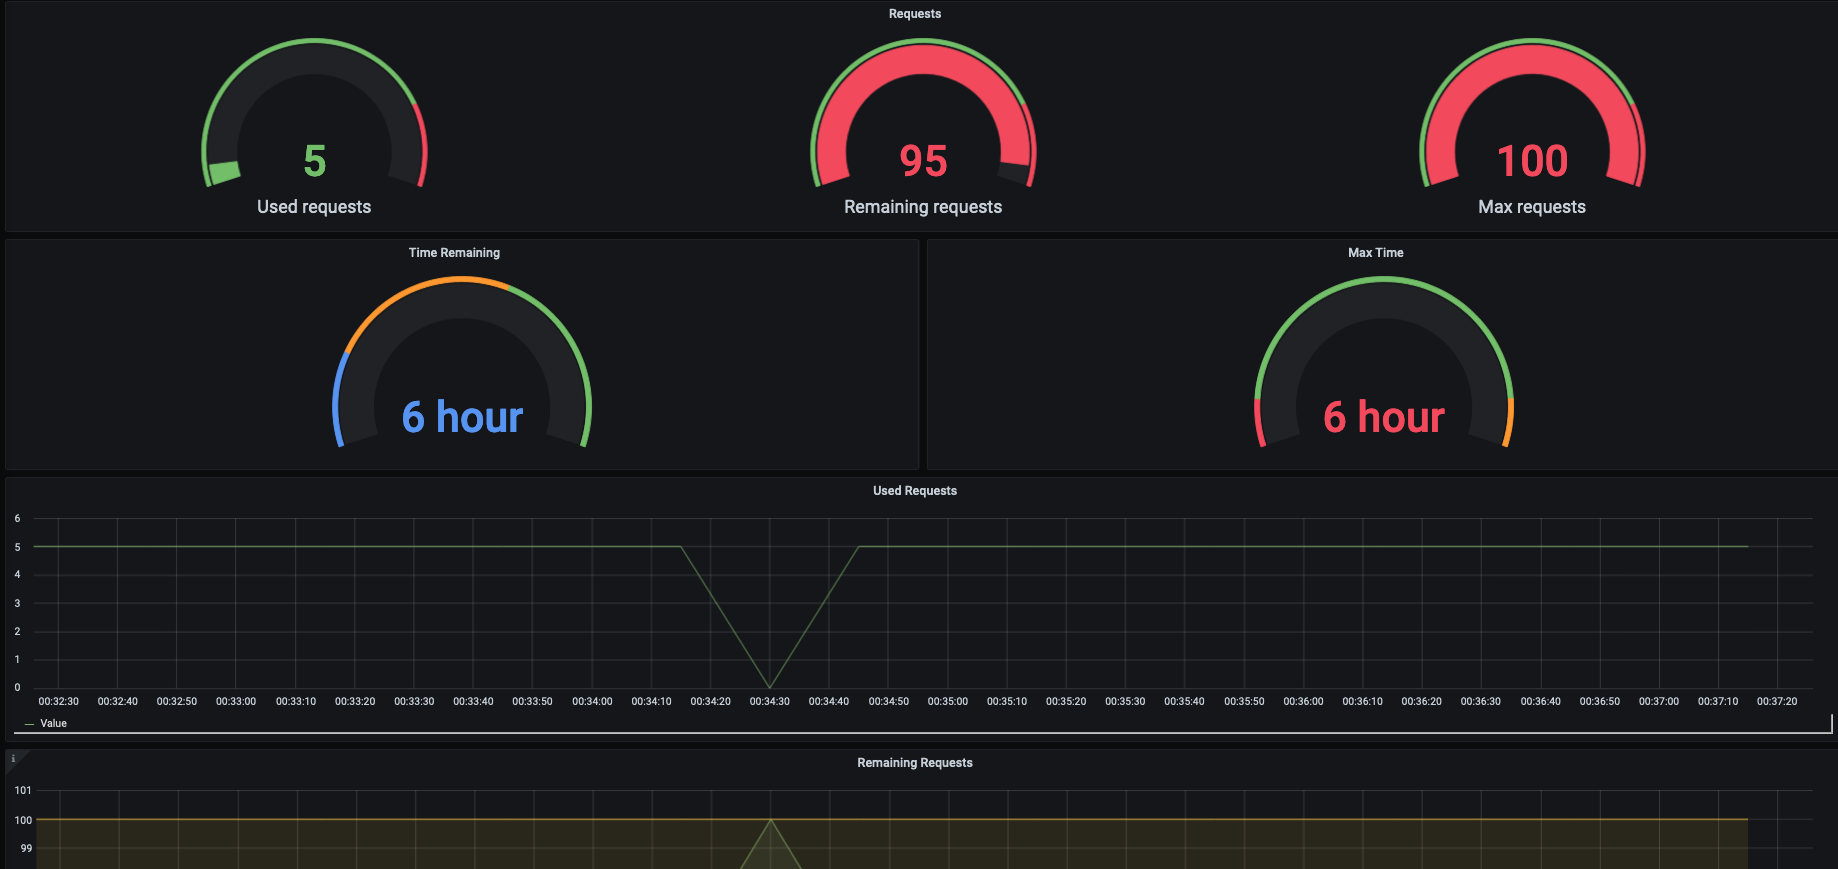
Usage
Multi Arch docker images are available (arm/arm64/amd64) you can pull it from dockerhub and run in your environment.
1docker pull khaliq/drl-exporter:latest
2
3docker run -d -p 2121:2121  khaliq/drl-exporter:latest
4
5curl localhost:2121/metrics
Output
 1# HELP dockerhub_limit_max_requests_time Dockerhub rate limit maximum requests total time seconds
 2# TYPE dockerhub_limit_max_requests_time gauge
 3dockerhub_limit_max_requests_time 21600
 4# HELP dockerhub_limit_max_requests_total Dockerhub rate limit maximum requests in given time
 5# TYPE dockerhub_limit_max_requests_total gauge
 6dockerhub_limit_max_requests_total 100
 7# HELP dockerhub_limit_remaining_requests_time Dockerhub rate limit remaining requests time seconds
 8# TYPE dockerhub_limit_remaining_requests_time gauge
 9dockerhub_limit_remaining_requests_time 21600
10# HELP dockerhub_limit_remaining_requests_total Dockerhub rate limit remaining requests in given time
11# TYPE dockerhub_limit_remaining_requests_total gauge
12dockerhub_limit_remaining_requests_total 99
To build the image in your local environment
1git clone https://github.com/m47ik/drl-exporter.git
2cd drl-exporter
3make docker
Configuration Variables
| Variables | Default Value | Discription |
|---|---|---|
| EXPORTER_PORT | 2121 | Server listening port |
| ENABLE_USER_AUTH | false️ | Must be set to true if providing username |
| DOCKERHUB_USER | "" | Dockerhub account |
| DOCKERHUB_PASSWORD | "" | Account password |
| DOCKERHUB_REPO_IMAGE | ratelimitpreview/test | custom repository/image |
Local Demo
You can find the complete docker-compose file along with a dashboard under deploy folder to test it out.
1cd deploy/docker-compose
2docker-compose up -d
Web UI
| Web | URL |
|---|---|
| Grafana | http://localhost:3000 |
| Prometheus | http://localhost:9090 |
| Exporter | http://localhost:8881 |
Helm Chart
git clone https://github.com/m47ik/drl-exporter.gitcd drl-exporterhelm install <release name> deploy/chart --namespace=<desired namespace>
Installing chart with username and password
You can tweak the options for chart by setting values at run time or values.yaml file.
If you intend to use the exporter with a username and password do remember to set the enableUserAuth=true as well.
1helm install my-release deploy/chart --set config.dockerhubUsername=<username>,
2config.dockerhubPassword=<password>,config.enableUserAuth=true  --namespace=<namespace>
Chart Configuration
| Parameter | Description | Default |
|---|---|---|
config.exporterPort |
Port the deployment exposes | 2121 |
config.enableUserAuth |
Enable metrics for specific dockerhub account | false |
config.dockerhubUsername |
Dockerhub Username | nil |
config.dockerhubPassword |
Dockerhub Password | nil |
serviceMonitor.enabled |
If true, creates a ServiceMonitor instance | false |
serviceMonitor.additionalLabels |
Configure additional labels for the servicemonitor | {} |
serviceMonitor.namespace |
The namespace into which the servicemonitor is deployed. | same as chart namespace |
serviceMonitor.interval |
The interval with which prometheus will scrape | 30s |
serviceMonitor.scrapeTimeout |
The timeout for the scrape request | 10s |